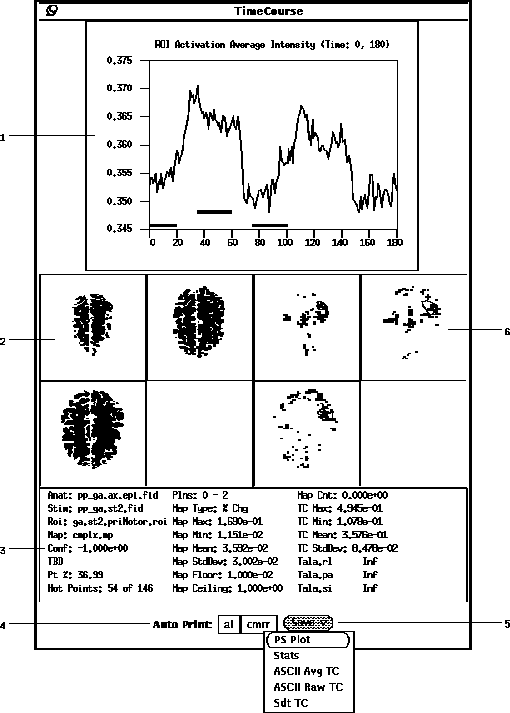
Figure 27: Full Time Course plot window.
The Full plot graph (27-1) displays an average time course of the hot pixels in the current ROI when it first pops up. A pixel is considered to be hot when it has a map value overlayed on it. If no map is currently being displayed then all the pixels in the current ROI are considered to be hot. The thick bars on the bottom of the graph indicate the control and stimulation periods.

Figure 27: Full Time Course plot window.
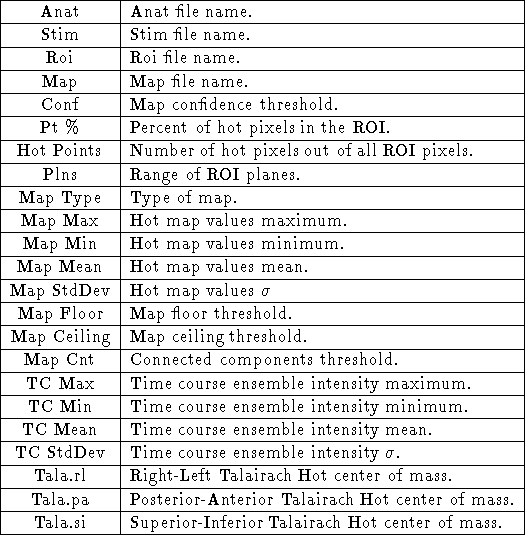
To illustrate where the time course came from, a mosaic of the greyscale images (27-2) and the map overlays (27-6) are provided. At the bottom of the popup window is a summary (27-3) which tells which files were used along with a variety of processing parameters and statistics as described in Table 5.

Table 5: Full Time Course Plot summary
The button (27-5) has five options to save data from the popup window. The entire popup window can be saved as a postscript file by selecting the PS plot option. If a printer is selected from the choice (27-4), the file is spooled to the printer when it is saved. The printer names are taken from the UNIX environment variable ``STIM_PRINTERS'' (See Section 2.2). If it has not been set, the default printer will be used. The summary can be saved to disk as an ascii file by selecting the Stats option. The single average time course or the entire ensemble of time courses can be saved in an ASCII file by selecting the ASCII Avg TC or ASCII Raw TC, respectively. The ensemble can also be save in a floating point sdt file using the Sdt TC.