CMRR
Center for Magnetic Resonance Research, Department of Radiology
PhysioFix peakEdit
You are here
Usage: peakEdit signalImg peakImgTo load the .sdt file pairs {respirCond.sdt, respirCond.spr}
and {respirPeak.sdt, respirPeak.spr}
Example> peakEdit respirCond respirPeakBoth .sdt files must be 1D Real (i.e. float). See Sdt File Format for details.
In addition, the peakImg must only have values of 0.0 and 1.0.
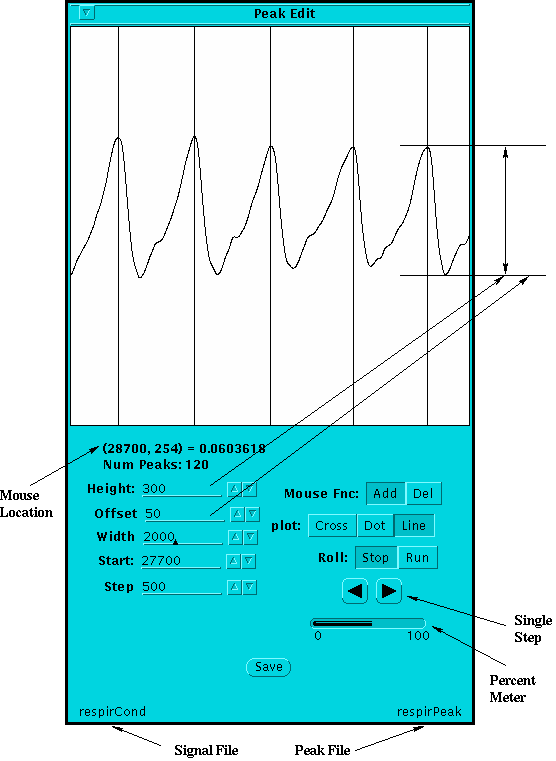
GUI (Graphical User Interface)

- Mouse Location
- (Horizontal, Vertical, Value) Position of the mouse, where Horz is in data point units and Vert is in canvas pixel units. The canvas is 400x400 pixels. Value is the data point value at the Horz location.
- Mouse Function
- Add or Delete a peak, as indicated by a vertical line, at the location of the mouse when the left mouse button is pushed. Make sure to Save the peaks if you edit them.
- Save
- Save the current peaks to the peakImg file.
- Num Peaks
- Number of peaks found in the peakImg file.
- Start
- First data point plotted.
- Step
- Amount to scroll the plot with Single Step or Roll.
- Single Step
- Scroll the plot forward or backwards by Step amount.
- Width
- Number of data points to plot.
- Plot
- Plot each data point as a cross, dot or connect adjacent data points with a line.
- Roll
- Dynamically scroll the plot by Step amount.
- Percent Meter
- Indicates the Start location relative to the total number of data points.
- Height
- The number of canvas pixels to scale the plot.
- Offset
- The vertical location in canvas pixels from the bottom to plot the minimum data point value.