MTM home
showTimeSVD
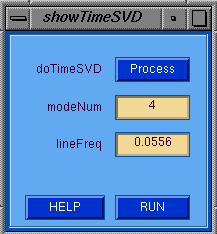
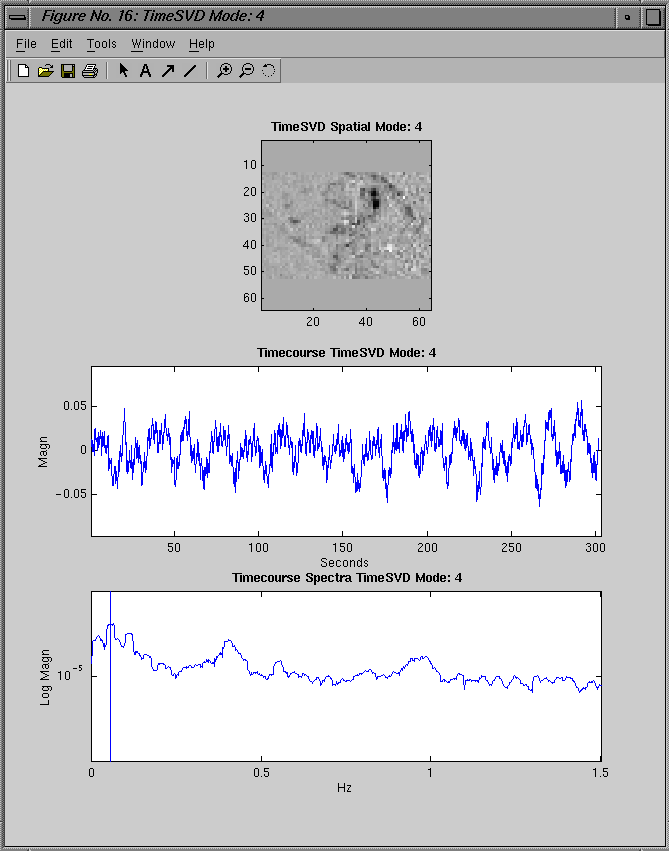
The showTimeSVD GUI is used to view the spatial magnitude
and time series of the leading modes from an SVD.
First the process button must be pressed to popup the
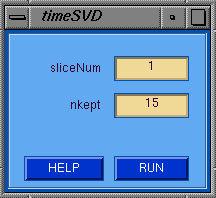
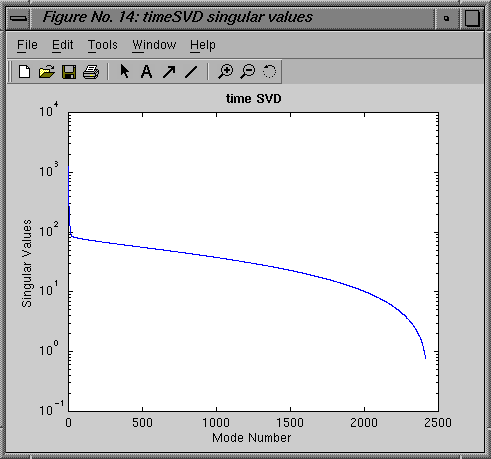
timeSVD window where the SVD can be invoked.  After the
SVD has been calculated, a particular mode can be viewed by
specifing the index in the modeNum field.   For reference,
a vertical line is plotted at the frequency specified in
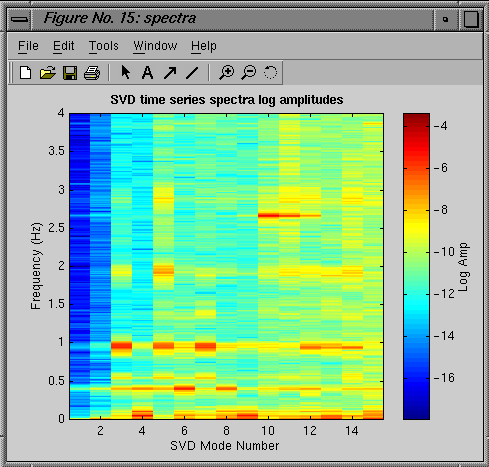
the field lineFreq.  When the RUN button is pressed, a
figure is displayed with an image of the spatial magnitude
along with a plot of both the timeseries and its spectrum
for the specified mode.
showTimeSVD GUI Tips
- doTimeSVD --> Popup timeSVD processing window.
- modeNum --> Index of the mode to display.
- lineFreq --> Frequecny at which to draw a line in the spectrum.
timeSVD GUI Tips
- sliceNum --> Index of slice to process.
- nkept --> Number of modes to keep.
Relative URL:/~strupp/mtm_doc/timeSVD.shtml
Last modified: Thursday, 03-Jan-2002 14:26:13 CST
