MTM home
T Test
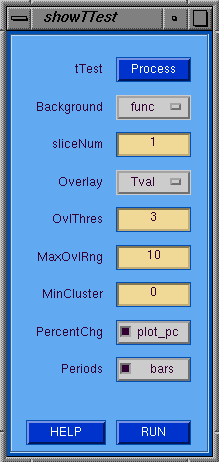
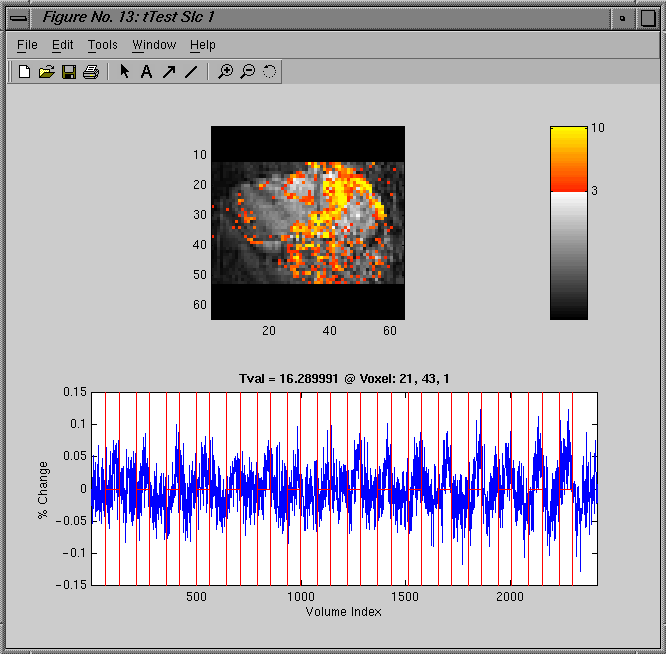
The showTTest GUI allows the user display the results
(i.e. Tvalue or Confidence (1.0 - Pvalue)) of a t-test
as an overlay map on top of the corresponding slice of
either the functional or anatomic data.  The overlay map
is color coded along a scale from the threshold value to
the MaxOvlRng.  Those pixels who belong to a cluster with a
size smaller than the MinCluster are not shown in the map.
If the PercentChg Plot option is selected, then when the
image is clcked by the mouse the underlying time series
is plotted with optionally the periods bars overlayed.
First the process button must be pressed to popup the
ttest window where the ttest can be invoked.
showTTest GUI Tips
- tTest --> Popup the T-test processing window.
- Background --> Type of image for background.
- sliceNum --> Slice number to display.
- Overlay --> Type of image for overlay.
- OvlThres --> Threshold value for overlay.
- MaxOvlRng --> Maximun display value for scaling overlay.
- MinCluster --> Minimum cluster size for overlay display.
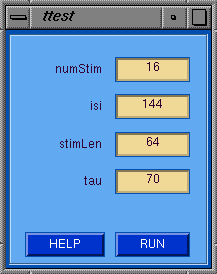
The ttest GUI allows the user to specify the t-test
parameters and invoke the calculation by pressing
the RUN button.
ttest GUI Tips
- numStim --> Number of stimulation/task periods.
- isi --> Inter-stimulus interval in volAcq units.
- stimLen --> Stimulation length in volAcq units.
- tau --> Delay until the first stimulation period in volAcq units.
Relative URL:/~strupp/mtm_doc/tTest.shtml
Last modified: Thursday, 03-Jan-2002 14:37:46 CST


