MTM home
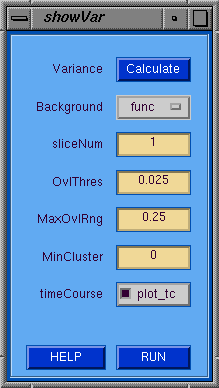
showVar
The showVar GUI is used to calculate and display the
variance of the time courses of the functional data.
The Calculate button must be pressed to invoke processing.
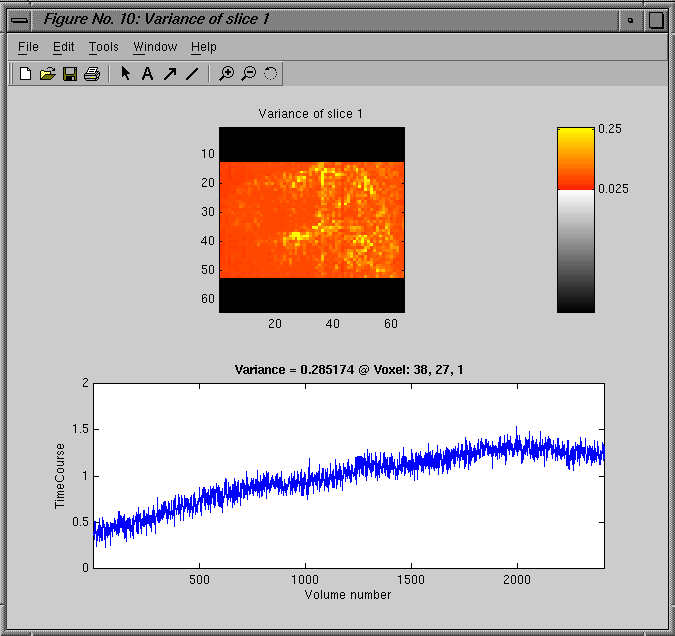
Pressing the RUN button will popup a display of the
variance map overlayed onto the specified background.
If the OvlThres and MaxOvlRng are not specified (i.e. set
to 0) then values are automatically determined.  If the
plot timeCourse option is selected, then clicking on
the displayed variance map will result in the associated
timecourse being plotted.
showVar GUI Tips
- Variance --> Calculate the time variance of the functional data.
- Background --> Type of image for background.
- sliceNum --> Slice number to display.
- OvlThres --> Threshold value for overlay.
- MaxOvlRng --> Maximun display value for scaling overlay.
- MinCluster --> Minimum cluster size for overlay display.
Relative URL:/~strupp/mtm_doc/std_dev.shtml
Last modified: Thursday, 03-Jan-2002 14:17:15 CST


