MTM home
freqSVD
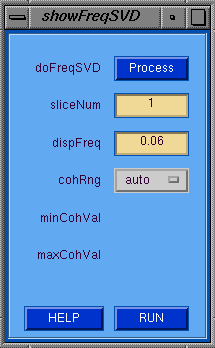
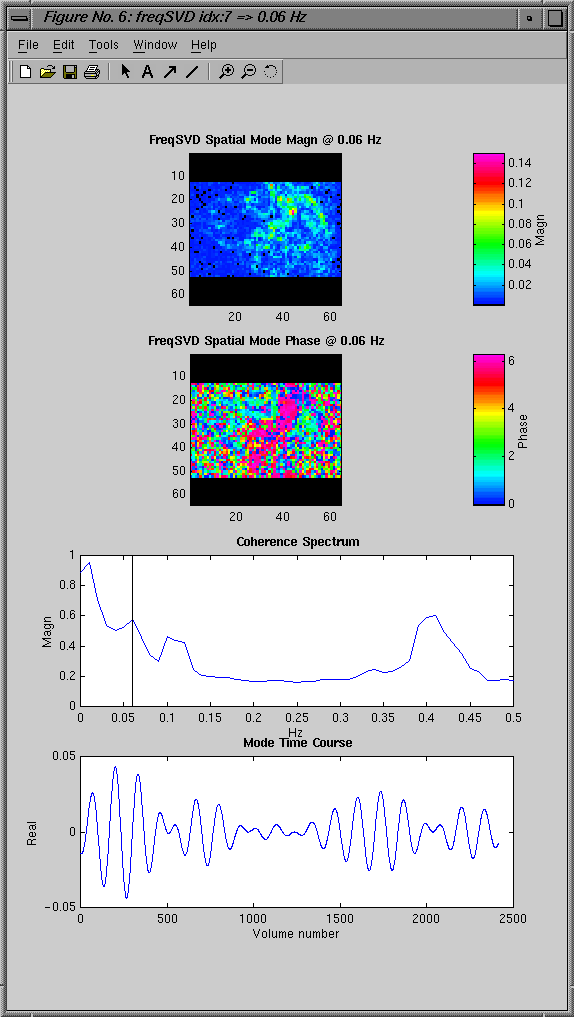
The showFreqSVD is used to view the spatial magnitude and
phase images of the mode at the specified frequency along
with the mode time course.  The coherence spectrum is also
ploted with a vertical line is plotted at the frequency
specified.  First the process button must be pressed to
popup the freqSVD window where the SVD can be invoked.
showFreqSVD GUI Tips
- doFreqSVD --> Popup freqSVD processing window.
- sliceNum --> Slice number to display.
- dispFreq --> Frequency for coherence image to display.
- cohRng --> Method for specifing coherence display range.
- minCohVal --> Minimum coherence display value.
- maxCohVal --> Maximum coherence display value.
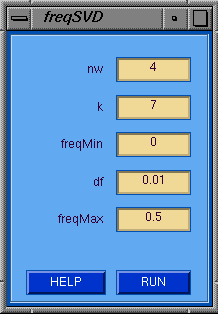
The freqSVD GUI allows for the user to specify the
multitaper parameters and the range of frequencies to
compute the SVD on.  When the RUN button is pressed,
the SVD calculation is invoked.
freqSVD GUI Tips
- nw --> Slepian Time-Bandwidth product.
- k --> Number of Slepian tapers (usu. 2nw-1)
- freqMin --> Minimum frequency of fsvd calculation.
- df --> Frequency step for fsvd calculation.
- freqMax --> Maximum frequency of fsvd calculation.
Relative URL:/~strupp/mtm_doc/freqSVD.shtml
Last modified: Thursday, 03-Jan-2002 14:29:07 CST


